experiment descriptions
Experiment descriptions are obviously very specific.
To view the XML schema for experiment description, please refer to http://www.crew-project.eu/cdf_xml/schema.html
For some examples, please browse through one of the experiments below:
Multi-antenna LTE sensing
Sensitivity measurement
This experiment derives from a metrology use case, where the multi-antenna sensing device can be used for downlink interference analysis of LTE cellular networks. The process consists of creating a list of the received signals on an LTE channel as well as obtaining their physical characteristics and identifying the base stations which are transmitting these signals. Interference analysis is based on the smart antennas approach employing an array of antennas. When this antenna array receives several sources emitted by different base stations, the signals are recombined in order to detect and demodulate each received source, while the other received signals are considered as interference that can be rejected when it comes from different directions. Since the matched filter approach is used for detection, the signal can be demodulated and system parameters like the physical layer cell identity, cyclic prefix length, duplex mode, base station signal level, Ec/I0, as well as time and frequency channel impulse response can be determined. The goal of the experiment is is to demonstrate the detection algorithm and hardware, as well as show the multi-antenna processing gain over a mono antenna sensing scenario.
Interference rejection measurement
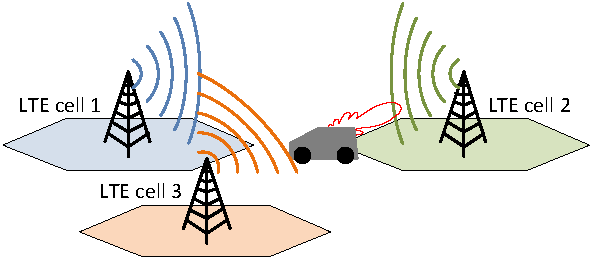
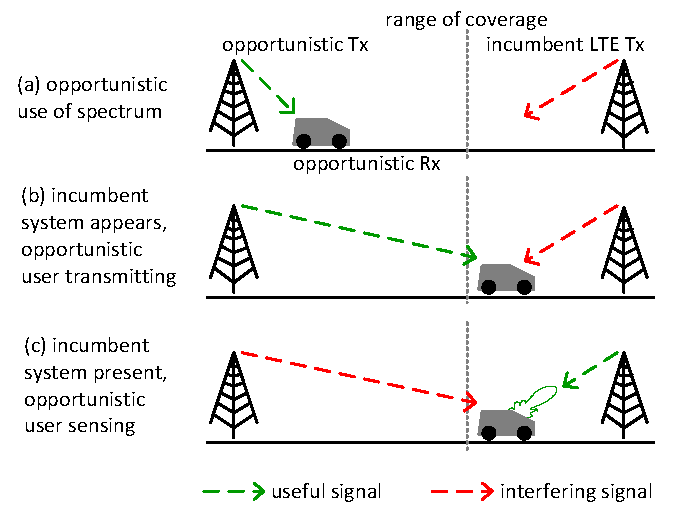
LTE detection with spatial interference rejection capabilities can also be useful for sensing in CR environments. Consider a mobile opportunistic receiver (Rx) uses a white space in a certain frequency band that is available at a particular geographic location (a). The system has to check periodically for the presence of an incumbent user that might be utilizing that band. When the mobile opportunistic Rx moves to a location where the white space is no longer available, it receives the signal from the incumbent LTE transmitter (Tx). While the opportunistic system is not aware of the presence of the incumbent Tx, it is still communicating and for the opportunistic Rx, the signal coming from the incumbent Tx is considered as interference (b). When the opportunistic Rx senses the spectrum, the signal coming from the incumbent LTE Tx is now the signal of interest and the signal from the opportunistic Tx the interference, as it is jamming the sensing process (c). Typically, during this process silent periods are allocated in the opportunistic system waveform, in order to perform sensing without being jammed by its own system. But sensing can also be performed simultaneously with the data transfer, if the opportunistic Rx has interference rejection capabilities, i.e. by using an antenna-array and antenna processing algorithms. The goal of this experiment is to demonstrate the interference rejection capabilities of the multi-antenna sensing platform
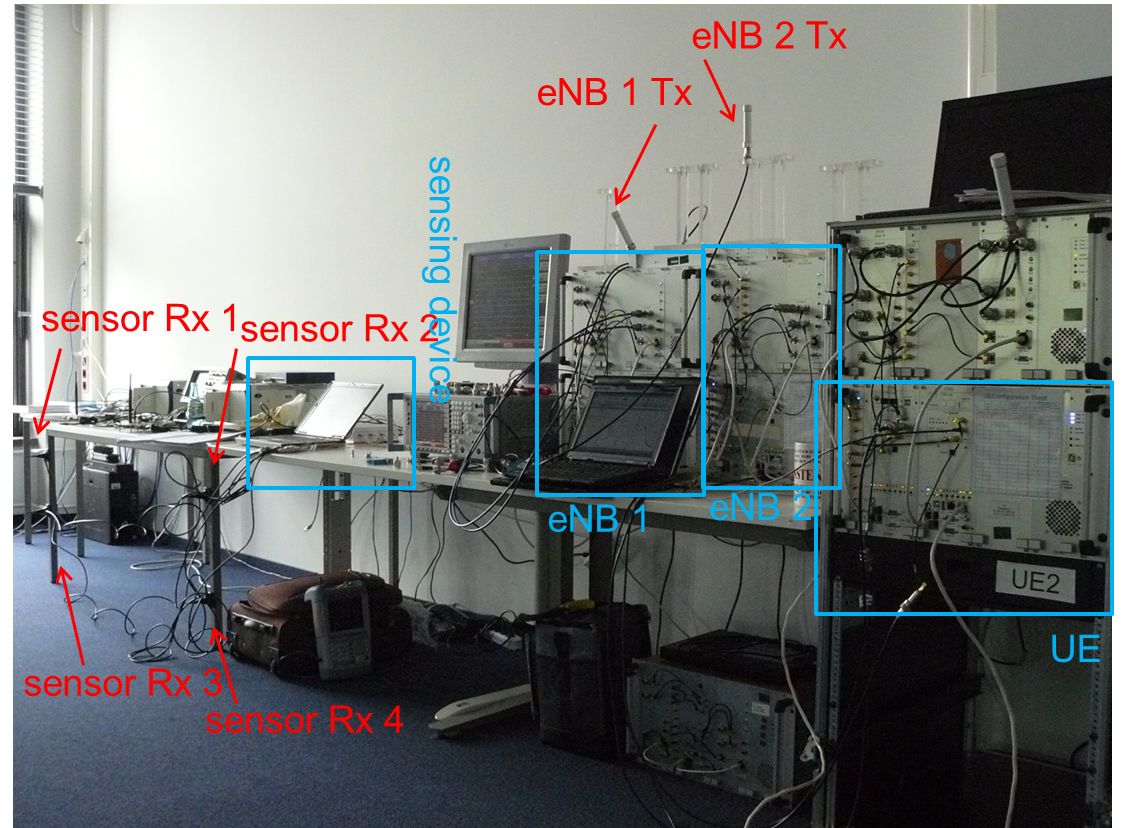
Setup Overview
Files
VESNA spectrum sensing in ISM 2.4GHz
VESNA spectrum sensing in ISM 2.4GHz in the Log-a-tec testbed
The Log-a-tec testbed supports experiments in ISM 868 MHz and 2.4 GHz and in UHF bands. In the ISM remote sensing and transmissions are possible while in the UHF only remote sensing is possible. For transmission on UHF bands, remotely emulating a wireless microphones with ISM 868 transmitters is possible while for anything more advanced, transmitters needs to be taken in the field (JSI has license to transmit in UHF bands).
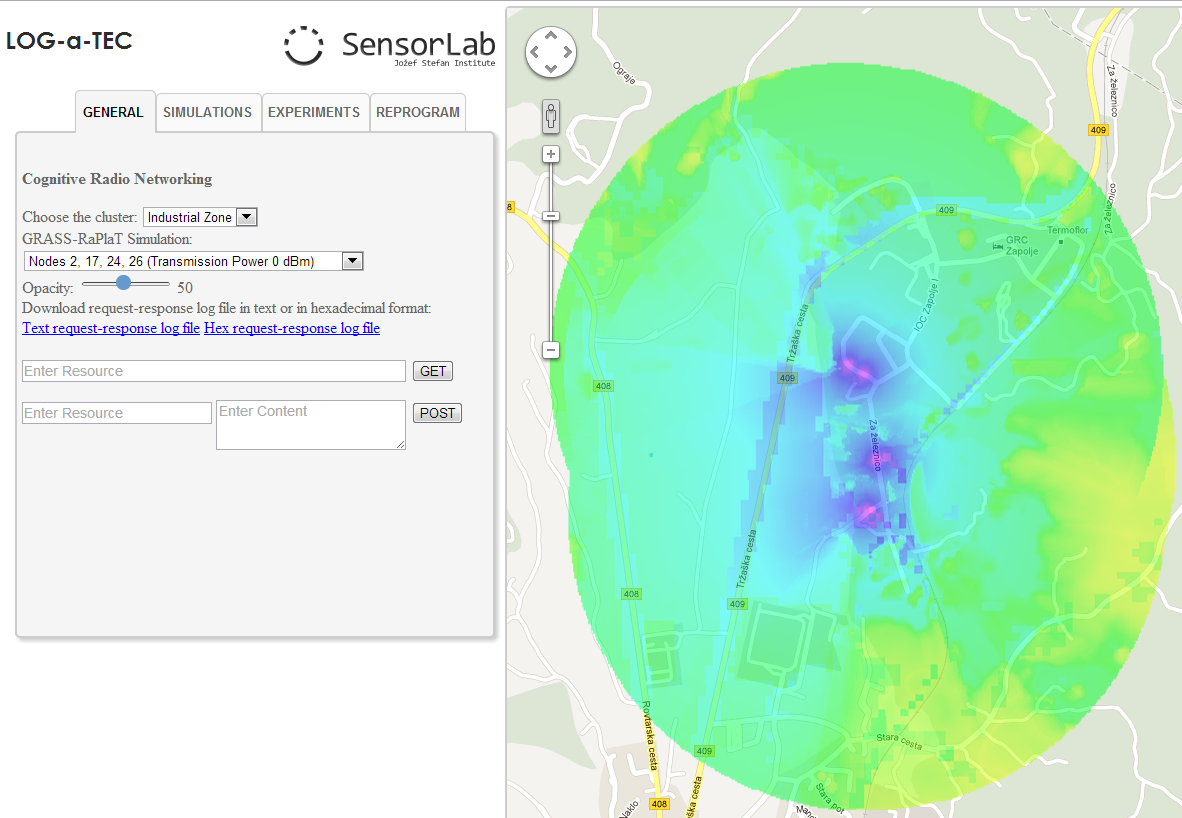
In the following, we discuss an ISM 2.4 GHz experiment description performed in the Log-a-tec industrial zone cluster depicted in the figure below.
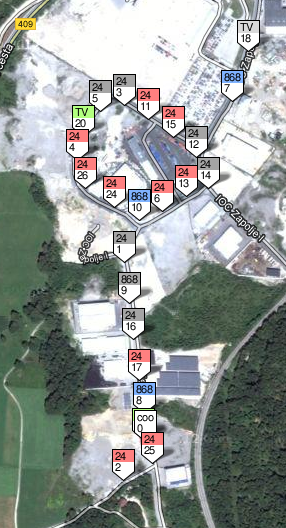
The experiment scenario is as follows. Three VESNA nodes (ids 25, 6, 4) from the Log-a-tec testbed are configured to perform spectrum sensing in the 2.4 GHz spectrum band. Four VESNA nodes (ids 2, 17, 24, 26) from the same testbed are configured to perform transmissions, each on a 200KHz channel in the 2.4 GHz band. The transmissions are performed in channels 50, 105, 155 and 205 and they start 5 seconds after the sensors start sensing the environment and end 5 seconds before the sensors stop sensing.
The portal facilitating the experiment configuration is presented in the figure below while the experiment description in CREW common data format are available in XML and JSON encoding below.
Files
Experiment description in common data format: JSON | XML
| Attachment | Size |
|---|---|
| VESNA_SS_24GHz.json | 13.29 KB |
| VESNA_SS_24GHz.zip | 2.34 KB |
| IndustrialZoneCluster.png | 308.52 KB |
| VESNA_SS_24GHz.png | 284.29 KB |
Wi-Fi throughput experiments
WI-FI throughput experiment
In the following experiment we examine WI-FI throughput performance under various interference conditions. In all experiments the throughput is logged as performance metric.
|
Name |
Description | Files |
| Distributed Sensing for identify hidden terminal effect |
This experiment involves two pairs of WI-FI nodes, located far away. We monitor the environment both with packet sniffing and distributed sensing via USRP sensing engine. One WI-FI group is considered system under test (SUT) while the other is considered as Interferer (INT). The transmit power of INT group is varied from 0 dBm to 20 dBm in step of 2 dBm, controlled via the benchmarking framework. It is seen that there is a interval where packet sniffing do not detect INT activity but distributed sensing can. |
|
| Interference caused by overlapping WI-FI channel | This experiment involves two pairs of WI-FI nodes, they operate on adjacent WI-FI channels. The amount of overlapping between the two pairs are controlled via benchmarking framework. The rarget is to find out how does WI-FI react to interference caused by WI-FI activities on the adjacent WI-FI channel | |
|
Interference caused by zigbee device |
This experiment involves only one pair WI-FI nodes. An narrow-band interference signal is generated by a nearby zigbee node |