


Wireless press conference optimization using SUMO toolbox
Problem Statement
A wireless press conference scenario comprises of a wireless speaker broadcasting audio over the air and a wireless microphone at the listner end playing the audio stream. This type of wireless network is gaining attention specially in a multi-lingual conferencing room where the speaker's voice is translated into different language streams and broadcasted to each listner where they select any language they want to hear the translated version. However the wireless medium is a shared medium and it is possible to be interfered by external sources and we want to optimize the design parameters which gives the best audio quality. Moreover, we also want to reduce the transmission exposure which is a direct measure of electromagnetic radiation. Transmission exposure is gaining attention these days related to health issues and regulatory bodies are setting limits on maximum allowable radiation levels. Thus our second objective is to search design parameters that lowers transmission exposure of the wireless speaker exposed on each listner. For this tutorial, two design parameters of the wireless press conference are selected (i.e. transmit channel and transmit power) and we optimize these parameters inorder to increase the audio quality and decrease transmission exposure.
Experiment scenario
The experiment is composed of one speaker and 5 listeners making the Solution Under Test (SUT) and one public access point creating a background interference. The public access point is connected to three WI-FI users and provides a streaming video service at the time. Figure 1 shows the experiment scenario.
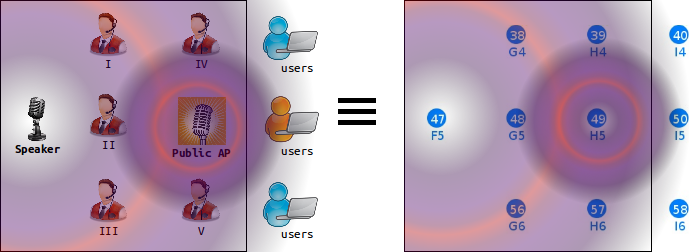
Figure 1. Experiment scenario of 5 listners, 1 speaker , 1 public access point, and 3 users.
On the left hand side, the realistic press conference scenario is shown. On the right hand side, the experimentation scenario as seen on the w.ilab.t zwijnaarde testbed [1] is shown. The horizontal and vertical distances between consecutive nodes is 6m and 3.6m respectively. All listener nodes (i.e. 38, 39, 48, 56, and 57) are associated to the speaker access point (i.e. node 47). Background interference is created by the public access point (i.e. node 49) transmitting on two WI-FI channels (i.e. 1 and 13) at 2.4Ghz ISM band.
The wireless speaker, configured on a particular transmit channel and transmit power, broadcasts a 10 second WI-FI audio stream and each listener calculates the average audio quality within the time frame. The wireless speaker at the end of its speech averages the overall audio quality from all listeners and makes a decision on its next best configuration. The wireless speaker using its newest configuration again repeats the experiment and produces a second newest configuration. This way the optimization process continues iterating until conditions are met.
The public access point on the other side transmits a 10 Mbps continuous UDP stream on both channels (i.e. channel 1 and 13) generated using iperf [2] application. In the presence of interference, audio quality gets degraded and the wireless speaker noticing this effect (i.e. lower audio quality) has two options to correct it. Either increase the transmission power or change the transmission channel. Making the first option is unlikely because it increases the transmission exposure. Changing the transmission channel also has limitations; the problem of overlapping channels interference [3]. Overlapping channels interference results in quality degradation much worse than identical channel interference. In identical channel interference, both transmitters apply CSMA-CA algorithm and collision is unlikely to happen. However in overlapping channels interference, transmitters don’t see each other and collision likely happens.
Two fold optimization
As was explained previously, we want to optimize the design parameters that brings an increased audio quality and decreased transmission exposure. A straight forward solution is to perform unique experiments at each design parameter combinations also known as exhaustive searching and locate the optimum design parameters which gives the highest combined objective (i.e. audio quality + transmission exposure).
Audio quality objective
In the earlier telephony system, Mean Opinion Score (MOS) was used for testing audio quality out of a 1 to 5 scale (i.e. 1 for the worst and 5 for the best quality). MOS is a subjective quality measure that no two people give the same score. However due to recent demands in Quality of Service (QoS), subjective scores are replaced by objective scores for the reason of standardization. Moreover, the earlier telephony system is now replaced by the more advanced Internet Protocol (IP) driven backbones where Voice over IP (VoIP) service becomes the prefered method of audio transportation.
In a VoIP application, audio quality can be affected by a number of factors. Amongst all packet loss, jitter, and latency take the most part. An objective quality measure based on these parameters is standardized as ITU-T PESQ P.862. A mapping of PESQ score to MOS scale is presented in [4]. Here packet loss, jitter, and latency are measured for a number of VOIP packets arriving at the receiver end. Averaging over arrived number of packets, jitter and latency are combined to form an effective latency which also considers protocol latencies. Finally, the packet loss is combined to effective latency in a scale of 0 to 100 called the R scale. Finally the R scale is mapped to 1 to 5 scale and MOS score is generated. Figure 2 shows the pseudo code excerpt of MOS calculation.
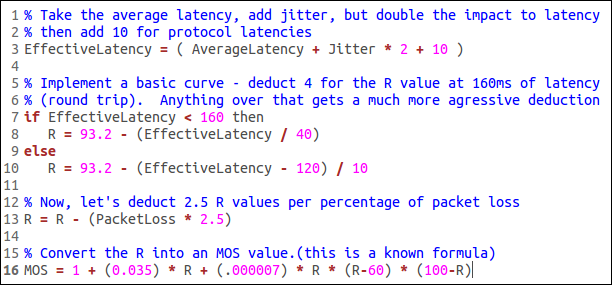
Figure 2. MOS score calculation code excerpt
Tranmission exposure objective
Transmission exposure is a direct measure of the electric-field strength caused by a transmitter. In [5] an in depth calculation of transmission exposure is presented. Exposure at a certain location is a combined measure of radiated power, transmitted frequency and path loss. Now a days regulatory bodies are setting maximum allowable exposure limits in urban areas. For example Brussels, captial city of Belgium, sets transmission exposure limit to 3v/m.
Characterizing the exposure model requires calculation of the path loss model specific to the experimentation site. The experimentation site at our testbed has a reference path loss of 47.19 dB at 1 meter and path loss exponent 2.65. Having this measurement, transmission exposure is calculated for each participating nodes and later average the sum over the number of nodes. Figure 3 shows the average exposure model.
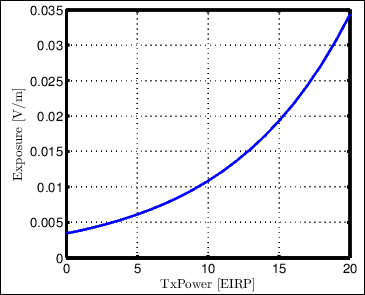
Figure 3. Average transmission exposure
Exhaustive searching optimization
The exhaustive searching optimization performs in total 13 channels x 20 TxPower = 260 experiments. Figure 4 and 5 shows performance output of the exhaustive searching optimization.
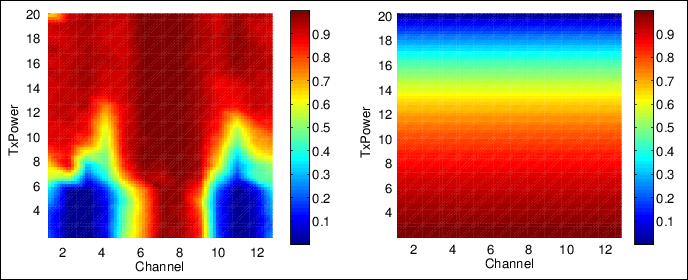
Figure 4. Audio quality and exposure global accurate model with background interference at channels 1 and 13
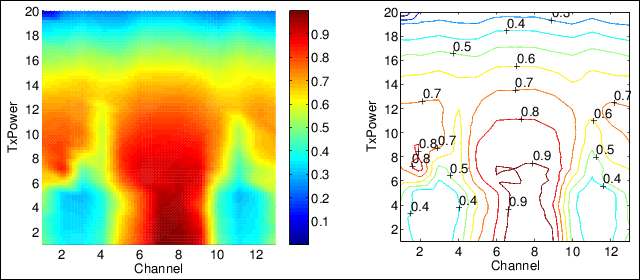
Figure 5. Dual objective and contour global accurate model with background interference at channels 1 and 13
The dual objective model shown in figure 5 is combined from the audio quality and exposure models shown in figure 4. Looking into the audio quality model, areas with a higher transmission power have good performance in general. However, there is an area on the non-interfered channel (i.e. 6 to 8), where there is a sudden jump in performance as TxPower increases from 4 dBm to 8 dBm. This area is of interest to us where higher audio quality and lower transmission exposure are seen. Indeed this is shown as a dark red region in the dual objective global accurate model.
Another aspect to look is the area where worst performance is recorded. Look again on the left side of figure 5 between channels 2 to 4, 10 to 12 and TxPower 1 to 7. Interestingly, this region is not located on channels where background interference is applied on but on its neighboring channels. This is due to the fact that the speaker and interferer nodes apply CSMA-CA algorithm on identical channel but not on neighboring channels which results in worst performance [3].
Note: TODO
Click the different areas on figure 4 to hear the audio quality when streamed at the specific design parameters
SUMO toolbox optimization
The exhaustive searching optimization gives the global accurate model however it takes very long time to finish the experimentation. Now we apply SUMO toolbox to shorten the duration and yet achieve a very close optimum value compared to the global accurate model shown in figure 5.
Start experiment execution using the preconfigured files located at the end of this page. The optimization process starts by doing 5 initial experiments selected using Latin Hypercube Sampling (LHS) over the design parameter space. LHS selects sample points on the design space evenly and with minimum sample points it assures providing the best dynamics of the system. For each of the five intial sample points, combined objectives are calculated which forms the inital dataset. The SUMO toolbox reads the inital dataset, creates a surrogate model out of it, and provide the next sample for experimentation to be carried on. The iteration continues until the stopping criteria is met. The stopping criteria selected, at the end of every iteration, sorts the collected combined design objective in ascending order and take the last five elements. Next calculate the standard deviation of this list and stop iteration when the standard deviation falls below threshold. A threshold of 0.05 is selected such that it is twice the standard deviation of a clean repeatable experiment [6]. The idea behind choosing such criteria is that the output of a sorted experiment approaches a flat curve as the optimization reaches the optimum. And the sorted last few elements show a small standard deviation.
Three sets of experiments are conducted and the results are compared to the global accurate model interms of Performance Gain (PG) and Duration Gain (DG) metrics. figure 7 shows the plot of sorted last 5 iteration standard deviation as a function of iteration/duration gain until stopping criteria (i.e. STD_MIN < 0.05) is met.
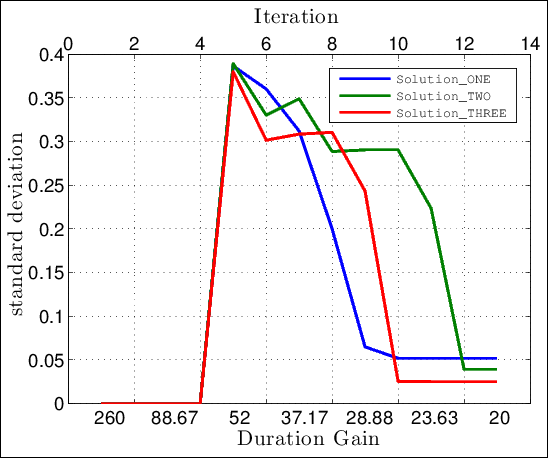
Figure 7. sorted last 5 iterations standard deviation plot
Shown in the figure above, all solutions stop execution around the 12th iteration (i.e. DG=21.5). Their perfomance gain compared to the global accurate model gives
Solution_ONE PG = [Solution optimum]/[Global accurate optimum] = -0.8261/-0.8482 = 0.9739
Solution_TWO PG = [Solution optimum]/[Global accurate optimum] = -0.8373/-0.8482 = 0.9871
Solution_THREE PG = [Solution optimum]/[Global accurate optimum] = -0.8352/-0.8482 = 0.9846
From the above results we conclude that by applying SUMO toolbox to wireless press conference problem, we improved the optimization process around 21.5 faster than the exhaustive searching optimization. And yet their performance is almost identical.
[1] http://www.ict-fire.eu/fileadmin/events/2011-09-2OpenCall/CREW/Wilabt_crewOpenCallDay.pdf
[2] Carla Schroder, ”Measure Network Performance with iperf” article published by Enterprise Networking Planet, Jan 31, 2007
[3] W. Liu, S. Keranidis, M. Mehari, J. V. Gerwen, S. Bouckaert, O. Yaron and I. Moerman, "Various Detection Techniques and Platforms for Monitoring Interference Condition in a Wireless Testbed", in LNCS of the Workshop in Measurement and Measurement Tools 2012, Aalborg, Denmark, May 2012a
[4] http://www.nessoft.com/kb/50
[5] D. Plets, W. Joseph, K. Vanhecke, L. Martens, “Exposure optimization in indoor wireless networks by heuristic network planning”
[6] M. Mehari, E. Porter, D. Deschrijver, I. Couckuyt, I. Morman, T. Dhaene, "Efficient experimentation of multi-parameter wireless network problems using SUrrogate MOdeling (SUMO) toolbox", TO COME
| Attachment | Size |
|---|---|
| audioQltyExpOptSUMO.tar | 1.9 MB |