


Visualiser & Analyser tools
Introduction
Both of the tools described on this page are made to visualise data that was stored in the MYSQL database during an experiment. The only difference between the visualiser and the analyser is how they show the data to the user. Please take a look at some examples you can find on the toolbox page.
Java Installation
The applet should work by default in Windows. Just install Java JRE if it doesn't.
In Ubuntu you will need to install the sun-java6-plugin to get the applet working. The applet will NOT load with the alternative OpenJDK plugin (IcedTea). If you don't find the sun-java6-plugin (apt-get install), then execute following steps where you replace lucid by your own Ubuntu version.
sudo add-apt-repository "deb http://archive.canonical.com/ lucid partner"
sudo apt-get update
sudo apt-get install sun-java6-jre sun-java6-plugin
sudo update-alternatives --config java
The applet has been tested in both Firefox, Internet Explorer and Google Chrome, but should work in other browsers too.
Visualiser
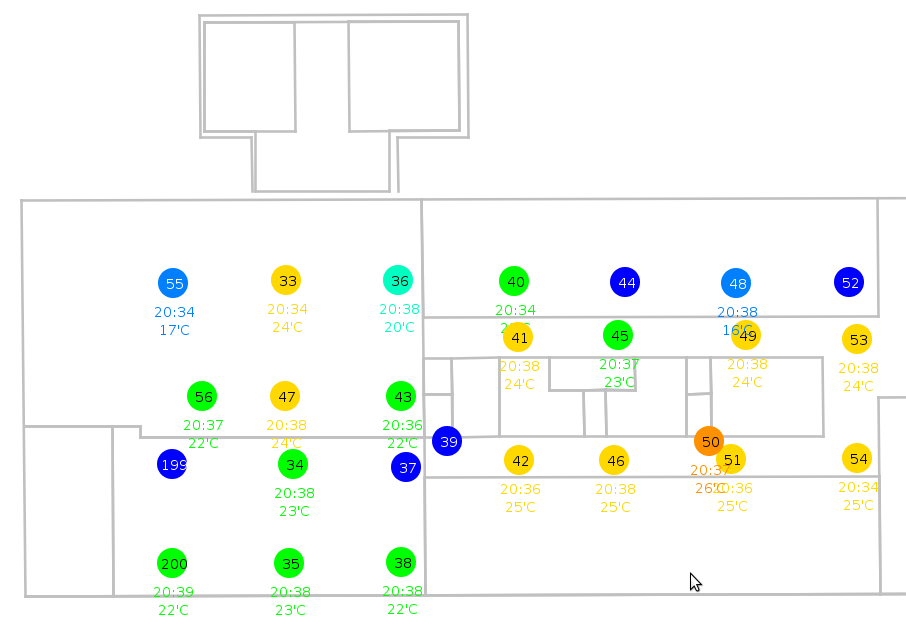
The visualizer shows information collected from the sensor nodes. The type of information and the properties of the visualiser are defined in a XML-file. You can define your own XML file. Temperature readings across the building are shown by default.
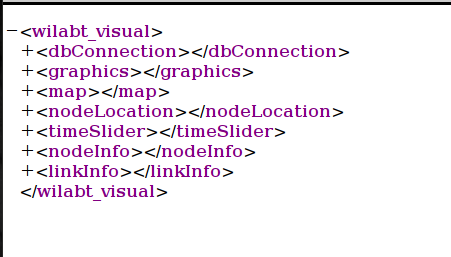
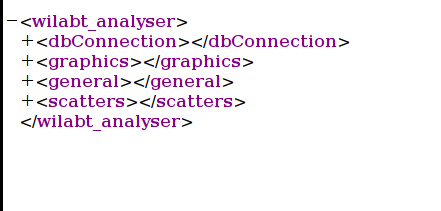
A visualiser XML file should follow the structure as shown in the picture below.
Database connection
The first section defines the connection to the MySQL database. The info below shows how to connect to the wilabinfo database on the Wilab.t server as user wilabinfo. This database contains information about the location of the nodes and the temperature and humidity readings they perform when no other experiment is running.
<dbConnection>
<host>wilab.atlantis.ugent.be</host>
<port>3306</port>
<database>wilabinfo</database>
<user>wilabinfo</user>
<password>wilabinfo</password>
</dbConnection>
Just change the database, user and password fields if you want to connect to your own user database. Your credentials can be found on the user-info page on Wilab.t.
Graphical Settings
The graphics section of the XML file allows you to adjust the looks of the visualiser. For most experimenters the default settings will be fine. If you want to play around with e.g. the diameter of the nodes, or the font of the text, just adjust the values in the right section and check out the result.
<graphics>
<zoom>1</zoom>
<heartbeat>1000</heartbeat>
<nodes>
<diameter>150</diameter>
<zoomFactor>0.8</zoomFactor>
</nodes>
<font>
<size>70</size>
<zoomFactor>0.8</zoomFactor>
</font>
<lines>
<thickness>1</thickness>
<zoomFactor>1</zoomFactor>
</lines>
<links>
<bidirectional>true</bidirectional>
</links>
</graphics>
Map section
The map section tells the visualiser where it can find the coordinates of all the walls. A wall is stored in the database by two coordinates (X1,Y1) representing one end of the wall and (X2,Y2) representing the other end. This section should never be modified if you are using the Wilab.t testbed. You could modify this section if you wanted to visualise e.g. your own building.
<map>
<sql info="selects all the nodes">
select x1, y1, x2, y2, floor from map where floor>0
</sql>
<column_x1>x1</column_x1>
<column_y1>y1</column_y1>
<column_x2>x2</column_x2>
<column_y2>y2</column_y2>
<column_floor>floor</column_floor>
</map>
Node locations section
Similarly to the map section, the node section defines the coordinates of all the nodes that you want to show on the visualiser. Every node is specified by an ID, an (X,Y) coordinate and a floor. This section should also not be modified for most experiments on Wilab.t.
<nodeLocation>
<sql info="selects all the nodes">
select id, x, y, floor from coordinates where floor>0
</sql>
<column_id>id</column_id>
<column_x>x</column_x>
<column_y>y</column_y>
<column_floor>floor</column_floor>
</nodeLocation>
Timeslider
The timeslider on the visualiser (double-click on the map) allows you to visualise your experiment after it has been completed. It also has the ability to automatically replay your experiment. The XML for this should never be modified.
Node info
This is probably the section where you will have to modify some things to represent your own experiment. There are 3 separate properties you can control :
- On every node you can define what label is shown on the node itself. This info is called the ID.
- Additionally you can define what kind of information is shown under the nodes. This is called the info field.
- Lastly you can choose what color is being used to display a node. This is the color field.
To show your own info, just write some SQL statement and give the result the alternative name as shown above (so id, info or color). The XML below shows an example of the temperature visualiser on Wilab.t.
<nodeInfo>
<sql>
SELECT
moteid as id,
CASE
WHEN avg(temp) = 0 THEN concat(hour(max(updated)), ":", minute(max(updated)))
WHEN avg(temp) > 50 THEN concat(hour(max(updated)), ":", minute(max(updated)))
WHEN avg(temp) > 0 THEN concat(hour(max(updated)), ":", minute(max(updated)), "~", round(avg(temp)), "'C")
ELSE 'no info'
END
as info,
CASE
WHEN avg(temp) = 0 THEN '0x000000'
WHEN avg(temp) > 50 THEN '0x000000'
WHEN avg(temp) > 29 THEN '0xFF0000'
ELSE '0x0000FF'
END
as color
from sensorinfo, timeInfo
where @timeslider -7*60 < UNIX_TIMESTAMP(updated) AND
UNIX_TIMESTAMP(updated) < @timeslider + 3*60
group by moteid
</sql>
<column_id>id</column_id>
<column_info>info</column_info>
<column_color>color</column_color>
</nodeInfo>
Link info
The visualiser is also able to show packet transmissions. A link has several properties :
- id_begin : the ID of the sending node
- id_end : the ID of the receiving node
- info : some extra information shown on the link
- color : the color of the arrow
If you don't want to show any link info, just leave the XML as shown below in the configuration file. If you want to show links, adjust the XML file in the same way as was shown for the Node info section.
<linkInfo>
<sql>
SELECT
0 as id_begin,
0 as id_end,
'1' as info,
'0x00FF00' as color
from sensorinfo
where id =0;
</sql>
<column_id_begin>id_begin</column_id_begin>
<column_id_end>id_end</column_id_end>
<column_info>info</column_info>
<column_color>color</column_color>
</linkInfo>
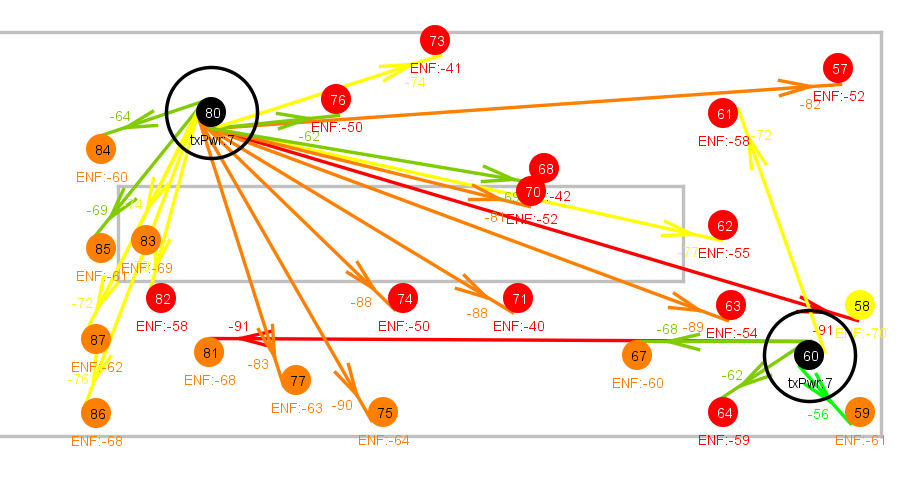
The figure below shows what can be achieved with the visualiser.
In this example node 60 and 80 are sending with transmit power 7 (txPwr) and all receiving nodes are pointed to with an arrow showing the receiving RSSI of that link. Also, every node shows its estimated noise floor (ENF) .
User Parameters
Whenever you want the visualiser to ask the user to fill in a parameter use three underscores before and after the parameter name (e.g. : ___MOTEID___ , ___Username___ , ___Password___ , ... ).
Analyser
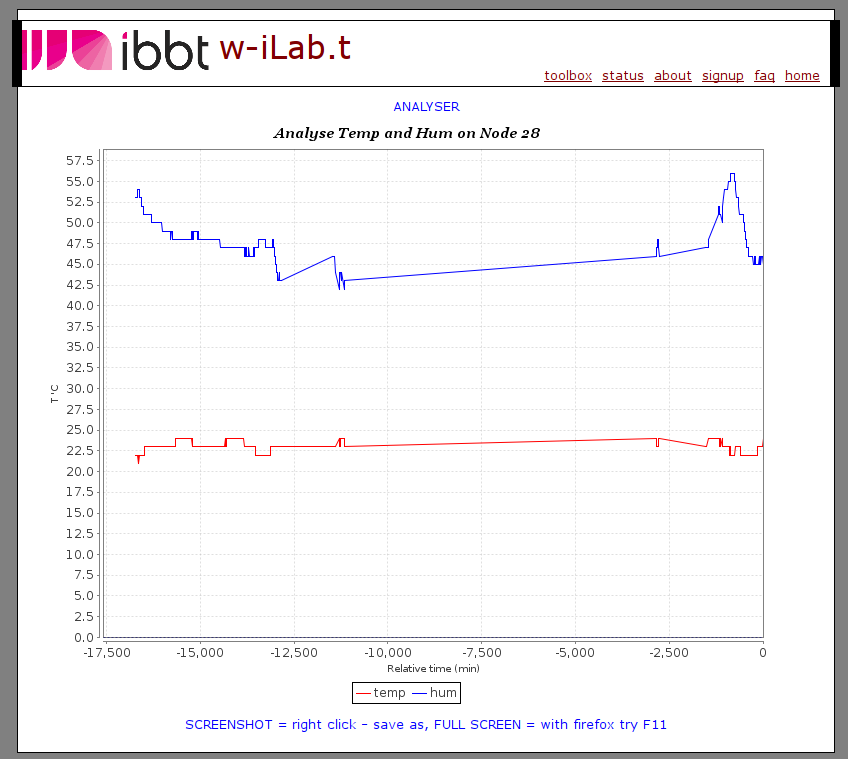
The analyser shows a chart with information collected from the sensor nodes. The type of information and the properties of the chart are defined in a XML-file. You can define your own XML file for the analyser. An example of the analyser showing temperature and humidity readings from node 28 is shown below.
The XML file looks like this :
Database connection
The database connection happens in the same way as for the visualiser.
Graphics
<heartbeat>10000</heartbeat>
<info>Analyse Temp and Hum on Node ___MOTEID___</info>
<xAxis>Relative time (min)</xAxis>
<xMin>0</xMin>
<xMax>0</xMax>
<xScaleStep>0</xScaleStep>
<yAxis>T 'C</yAxis>
<yMin>0</yMin>
<yMax>0</yMax>
- The heartbeat defines the refresh rate of the analyser (in seconds)
- Info defines the label that is shown at the top of the analyser.
- xAxis : label on the x axis
- xMin : start of the range for the x axis (can be 0 if x is defined in the scatter section)
- xMax : end of the range for the x axis (can be 0 if x is defined in the scatter section)
- xScaleStep : size of the steps on the x axis (can be 0 if x is defined in the scatter section)
- yAxis / yMin / yMax : Same as x axis
General
This section can be used to prepare some views that can be used in the scatter section.
<prepareView info="get last samplereport">
CREATE OR REPLACE VIEW sensorinfofirst AS
select *
from sensorinfo
where motelabSeqNo <= 20
ORDER BY motelabSeqNo DESC
</prepareView>
In this example you could then use the view sensorinfofirst in the scatter section.
Scatters
In the example below two scatters are defined. One shows the temperature on the y-axis, the other one shows the humidity. Both scatters have relative time as x-axis.
<scatters>
<scatter>
<name>temp</name>
<color>0xFF0000</color>
<sql>
select TIMESTAMPDIFF( MINUTE, timeInfo.lastInsert, updated) as x, temp
from sensorinfo, timeInfo
where moteid=___MOTEID___
ORDER BY updated DESC, id DESC
</sql>
<column_x>x</column_x>
<column_y>temp</column_y>
</scatter>
<scatter>
<name>hum</name>
<color>0x0000FF</color>
<sql>
select TIMESTAMPDIFF( MINUTE, timeInfo.lastInsert, updated) as x, hum
from sensorinfo, timeInfo
where moteid=___MOTEID___
ORDER BY updated DESC, id DESC
</sql>
<column_x>x</column_x>
<column_y>hum</column_y>
</scatter>
</scatters>
User Parameters
Whenever you want the analyser to ask the user to fill in a parameter use three underscores before and after the parameter name (e.g. : ___MOTEID___ , ___Username___ , ___Password___ , ... ).
Debugging
If you start writing your own visualiser or analyser XML configuration files, be sure to activate the java console. This way you can see that queries the applet will execute and track down errors if necessary.
How to enable java console in
- Ubuntu :
- Open a terminal and type : jcontrol
- Go to the advanced tab and expand the Java console item.
- Select Show console and click OK
- Restart your browser just to be sure the new settings are activated.
- Windows :
- Start > Control Panel > Search for Java
- Click the Java icon
- Go to the advanced tab and expand the Java console item.
- Select Show console and click OK
- Restart your browser just to be sure the new settings are activated.